On previous cruises, I had not cared too much about the actual route of travel, and had no
way to track that route with any of the trinkets that I own. This time it was
different. I was very much interested in our route near the Antarctic Peninsula,
as well as, our route through the Tierra del Fuego area of extreme South America.
In addition, I learned about a GPS tracking device that might be able to help me track our
cruise route through those areas. This device is the
QStarz BT-Q1000XT
, which I bought from Amazon. I tested the device before the cruise and was quite
impressed by it's performance and accuracy, so I took it with me. On the cruise, the device was attached
to our balcony railing with a Velcro strap at all times we were in motion, recharged in place
using a power brick, and the data was downloaded periodically as necessary. I ended up
with 15 separate data files that contained a combined 883,693 separate data points, each point
a map coordinate.
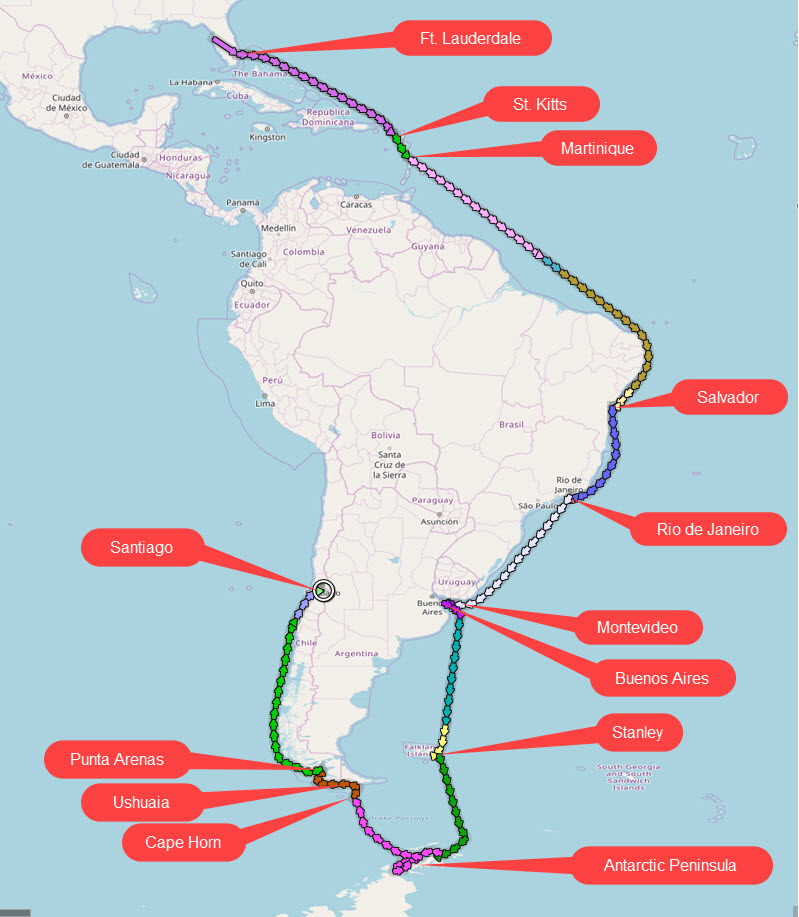
Picture-1 below shows all data points displayed on a flat map. This flat map
distorts some land areas to allow it to be flat. (We all know that if you peel the
display covering off of a globe, it would not lay flat. You would have to stretch
the edges near the poles, which would distort the size of the land areas. The farther away from
the equator, the more stretch required.) This map shows the ports that we visited
in relation to the cruise track. The colors on the track are not significant - they
mostly define the source data file. On the other hand, the arrows indicate the direction
of travel, from near the top, down the east coast of South America, around the Antarctic area,
and up the west coast of South America to Santiago.
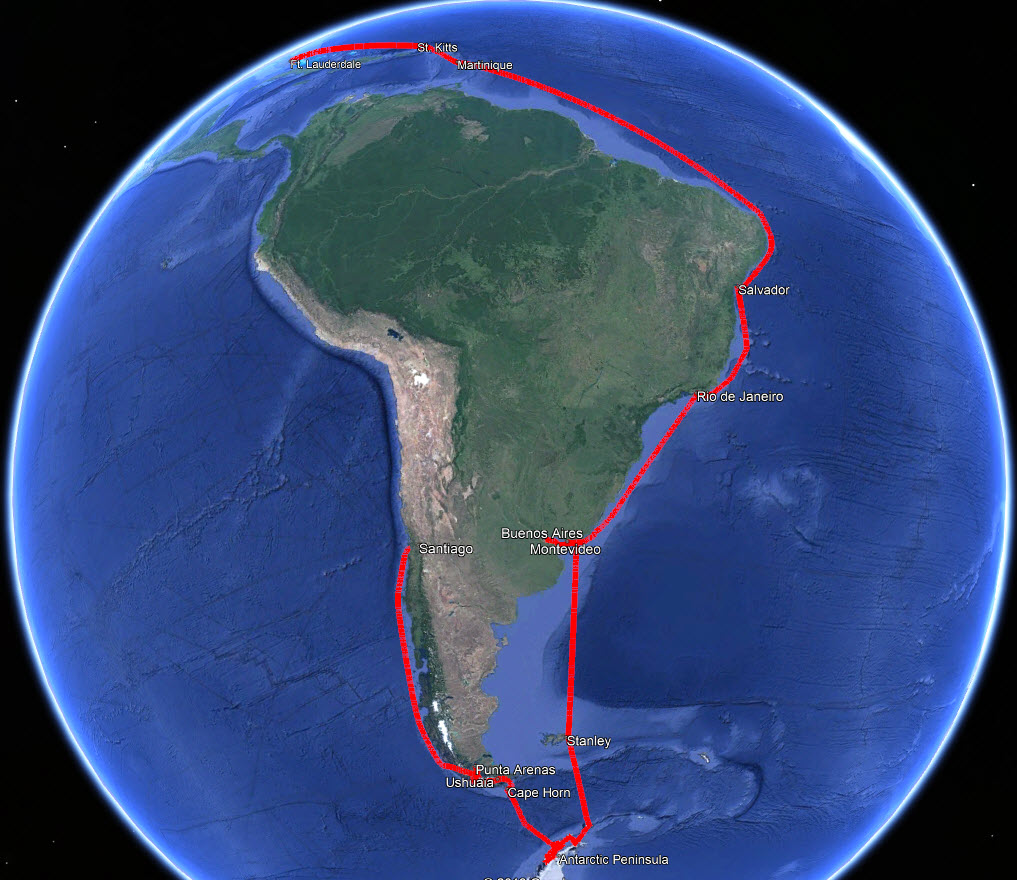
Picture-2 shows all of the data points converted to Google Earth format with place names.
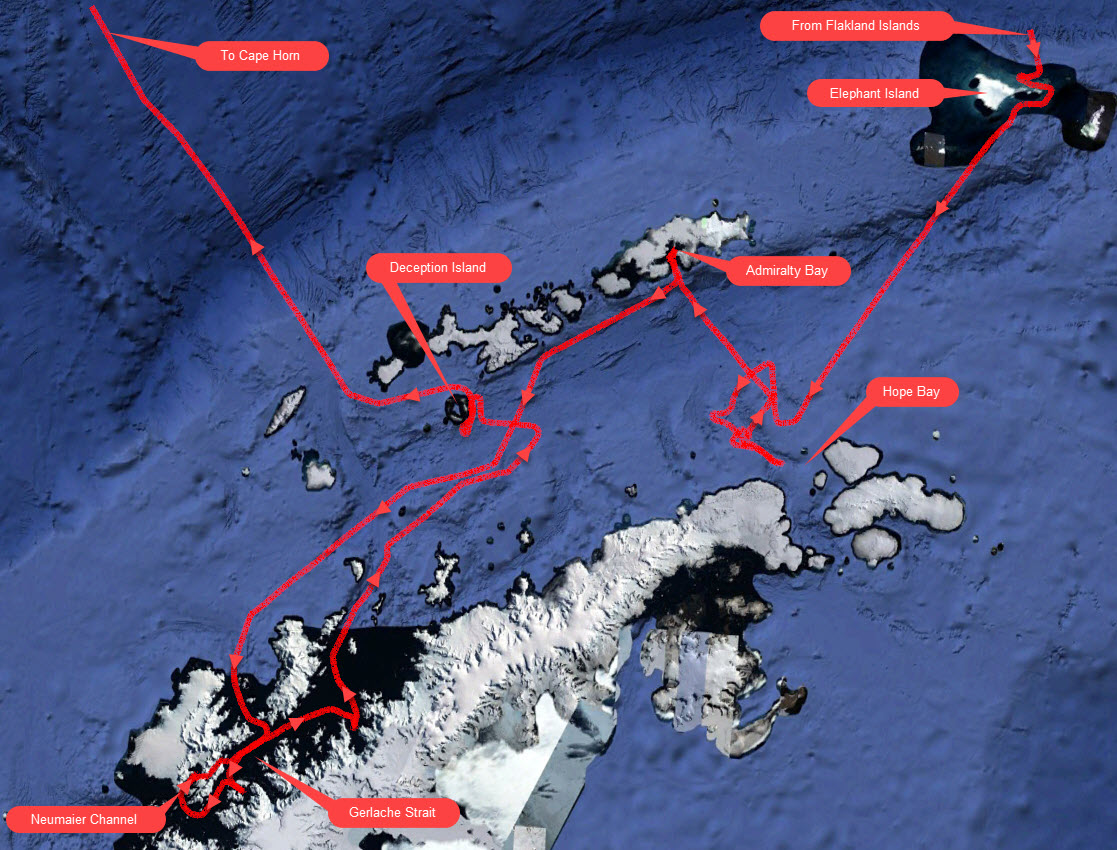
Picture-3 is a semi-close-up of the Antarctic area, with the local places labeled.
I also painted arrows on the lines so you could follow the path from entry north of Elephant
Island to the exit point north of Deception Island.
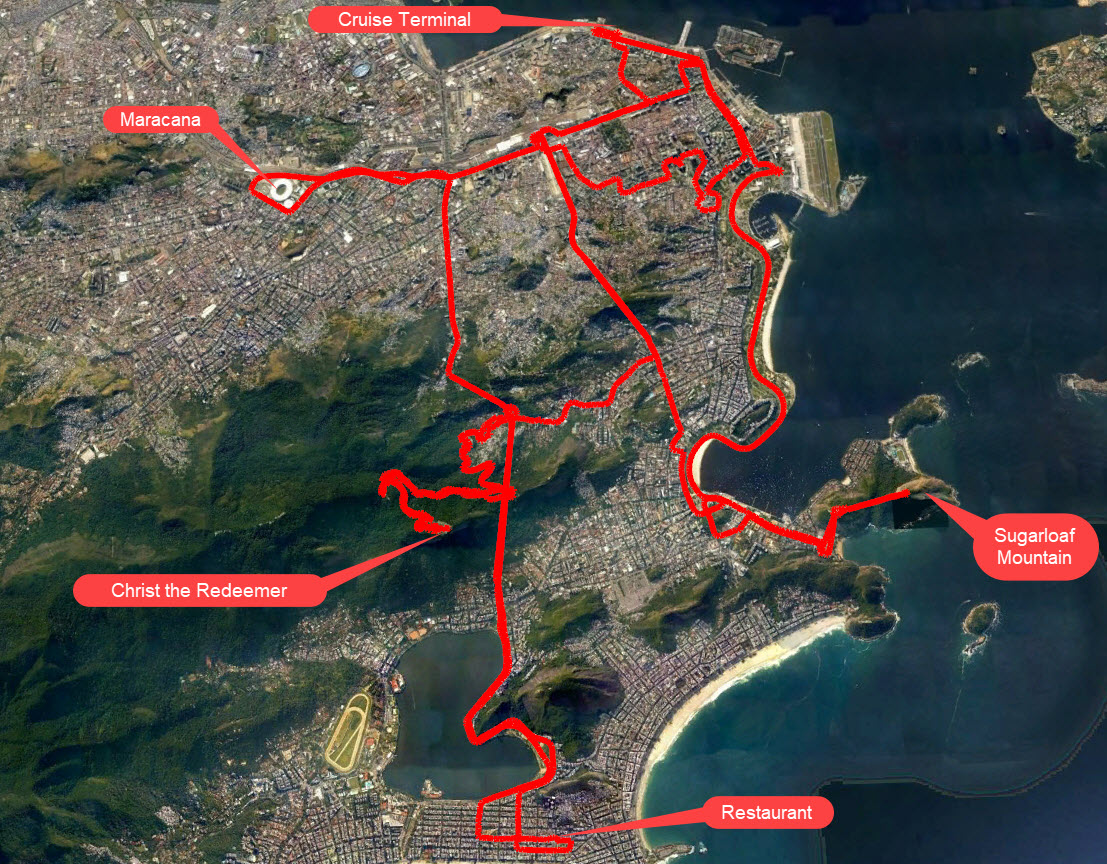
Picture-4 shows Rio de Janeiro with our excursion route in red, and
some of our stops labeled. Our tour began and ended at the cruise terminal and followed
the path shown. Note the very squiggly line up the mountain to the Christ the Redeemer
statue, and also note that we did not stop at the Maracana Stadium, just drove around it.
And finally, Picture-5 shows the data converted into Google Maps format. I just recently
learned how to do this. I think this presentation is the best because it allows
you to zoom in and out and see details of particular places. For example, zoom in to
the area near Montevideo, and you can see the circle route that the captain took while
evaluating whether to land at Montevideo on a bad weather day. He eventually
decided to skip this port and went back out to the Atlantic and headed for Falkland Islands.
For your reference, here is a link to our
cruise itinerary
and here is a link to my
written log
of the trip.
Send me an email at gsuther@gmail.com if you have comments.
Pictures below
Picture-1. Entire cruise on a flat map.
Picture-2. Entire cruise in Google Earth with ports labeled.
Picture-3.
This is a picture of the tracking data I recorded while we are near Antarctica.
We enter from the top-right, proceed down toward Hope Bay, then to Admiralty Bay, then to
the Gerlache Strait and Neumaier Channel, then up to Deception Island, and off to Cape Horn.
Picture-4. Rio de Janiero excursion with major stops labeled.
Picture-5. This map will take a few seconds to load.
This is the entire cruise in Google Maps. Note that you can click the
little square symbol at the upper right of the map to makeit full-screen, then you can zoom in or out using the
scroll wheel on your mouse or by clicking the plus or minus sign in the lower left corner.